Google Earth Engine tip 2 (Cyclone Thumnail)
Published on May 27, 2021 | Bikesh Bade | 1705 Views
The Indian Ocean cyclone season has no official bounds, but cyclones tend to form between April and December, with the peak from May to November. With Google Earth Engine you can create and visualize the cyclone in the video for a particular day.
Before you start to code, you need to know the satellite which provides the weather data. There is lots of weather satellite currently, for this sample study, I used JAXA Earth Observation Research Center Global Satellite Mapping of Precipitation (GSMaP) provides a global hourly rain rate with a 0.1 x 0.1-degree resolution. GSMaP is a product of the Global Precipitation Measurement (GPM) mission, which provides global precipitation observations at three-hour intervals.
The process to create Thumbnails in GEE is simple, steps are:
1. Create an image collection
2. Filter the image collection based on DateTime and area of interest
3. Define video parameters based on the area of interest and need.
4. Create Thumnai UI and print a link to export.
Import data to GEE editor
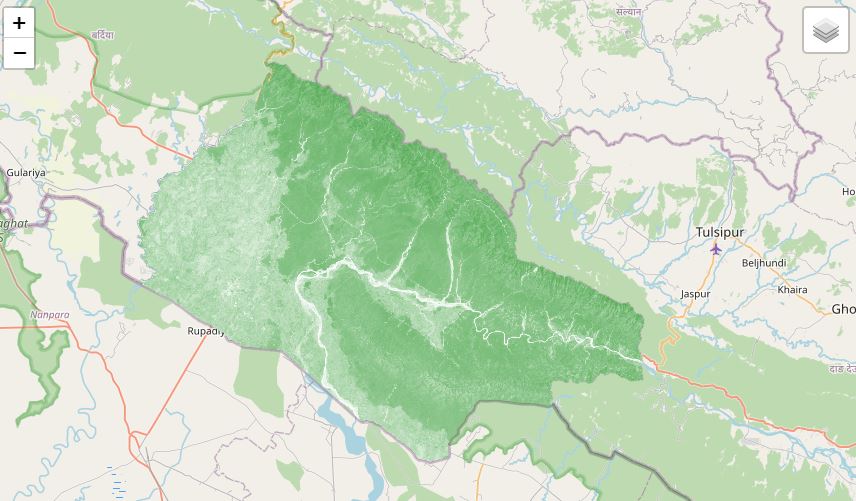
To create a video in GEE, all you need the image collections. To make the geographic video more attractive, we can add country boundaries. Country data can be load with data catalog GEE under the heading The United States Office of the Geographer provides the Large Scale International Boundary (LSIB) dataset.
// Import precipitional data from the JAXA
var precipitation = ee.ImageCollection('JAXA/GPM_L3/GSMaP/v6/operational')
                  .filter(ee.Filter.date('2021-05-25', '2021-05-27'))
                 .select('hourlyPrecipRate');


// Define visualization arguments to control the stretch and color gradient
// of the data.
var precipitationVis = {
  min: 0.0,
  max: 30.0,
  palette:
      ['1621a2', 'ffffff', '03ffff', '13ff03', 'efff00', 'ffb103', 'ff2300'],
};


// Convert each image to an RGB visualization image by mapping the visualize
// function over the image collection using the arguments defined previously.
var precipitationVis = precipitation.map(function(img) {
  return img.visualize(precipitationVis);
});

// Import country features and filter to South American countries.
var southAsia = ee.FeatureCollection('USDOS/LSIB_SIMPLE/2017')
  .filterMetadata('wld_rgn', 'equals', 'S Asia');

// Add south Asian countries to MAP
Map.addLayer(southAsia)
The Next step is to define the video parameters. As we are adding vector layer to the thumbnails, we need to convert it to paint and blend with the image collections
// Define an empty image to paint features to.
var empty = ee.Image().byte();

// Paint country feature edges to the empty image.
var southAmOutline = empty
  .paint({featureCollection: southAsia, color: 1, width: 1})
  // Convert to an RGB visualization image; set line color to black.
  .visualize({palette: '000000'});

// Map a blend operation over the temperature collection to overlay the country
// border outline image on all collection images.
var precipitationOutline = precipitationVis.map(function(img) {
  return img.blend(southAmOutline);
});

// Define animation arguments.
var videoArgs = {
  dimensions: 768,
  region: geometry,
  framesPerSecond: 7,
  crs: 'EPSG:3857'
};

// Display the animation.
print(ui.Thumbnail(precipitationOutline, videoArgs));

// Alternatively, print a URL that will produce the animation when accessed.
print(precipitationOutline.getVideoThumbURL(videoArgs));
Link to the code